Sensitivity of urban seismic damage predictions to input data detail
Project 3 "Technologies for advances environmental monitoring and seismic forecasting"
Product 3.1 "Automatic procedure for near real-time mapping of seismic shaking and associated consequences at the urban scale"
Reference: https://doi.org/10.1007/s10518-026-02371-6
Exposition
Monitored Buildings
Currently, four buildings are monitored in Sanremo, chosen for their strategic role in emergency
management and their representativeness of the local building stock (Cattari et al. 2024). The
instrumentation of these structures is tailored to capture both ground motion and building response.
Three hotels are each equipped with geophone sensors at their base to record the seismic input and MEMS
capacitive accelerometers at the top to measure the structure's dynamic reaction. The town hall
leverages a pre-existing Kinemetrics ETNA2 sensor at its foundation, originally part of the Civil
Protection network, which has been supplemented with a new MEMS accelerometer at its top to complete the
dual-sensor setup. All data recorded by these instruments is streamed in real-time to the North-Western
Italy Seismic Network (RSNI), which is managed by the DISTAV Department of UniGe, thereby enhancing
regional seismic monitoring and providing critical data for site-specific vulnerability assessments.
ISTAT versus IN SITU data
This layer shows the percentage error between ISTAT data and IN-SITU survey data for the number of
residential buildings. The comparison is provided for three categories: total residential buildings,
masonry residential buildings, and reinforced concrete residential buildings. A colour scale is used to
represent the degree of discrepancy. Green areas signify an exact correspondence between ISTAT and
IN-SITU data, while yellow indicates a slight error of up to 25%. Orange represents a moderate error
(between 25% and 50%), and red highlights areas with a high error, where the difference is greater than
50%. In some cases, the discrepancy is high (especially for reinforced concrete buildings), but it is
important to consider that the number of buildings is often very small for some census track (1 or 2
units).
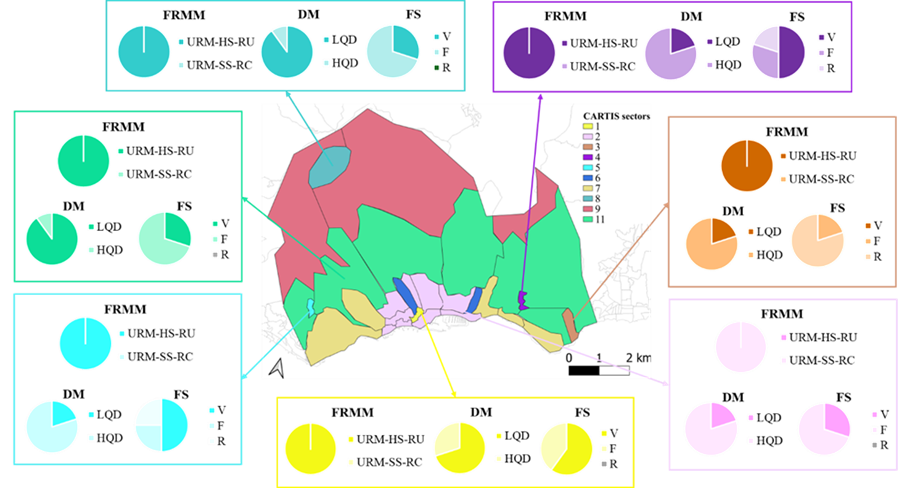
CARTIS sectors
To achieve a more detailed characterization of the residential building stock, this study utilizes the
CARTIS surveys (Zuccaro et al., 2015) conducted in the Municipality of Sanremo. Based on these surveys,
the entire municipal area is subdivided into "sectors"—areas with similar construction characteristics.
For each sector, detailed information on the local residential building stock is provided, including the
Force Resisting Mechanism Material (FRMM); the Details and Maintenance (DM) level (High quality-HQD or
Low quality-LQD); the Floor System (FS) type (Rigid-R, Flexible-F, or Vaults-V); and the Height Level
(HL) (Low-rise 1–2, Mid-rise 3–5, or High-rise 6–7 stories). This data is then used to develop a
tailor-made fragility curve for each sector that accounts for these prevalent local specificities.
Partners